2026 Report: ChatGPT Search Demand in Australia and NZ
Use this 2026 report of 22 verified Keyword Planner phrases to compare ChatGPT, Google AI, AI chat and Perplexity AI demand across Australia and New Zealand.
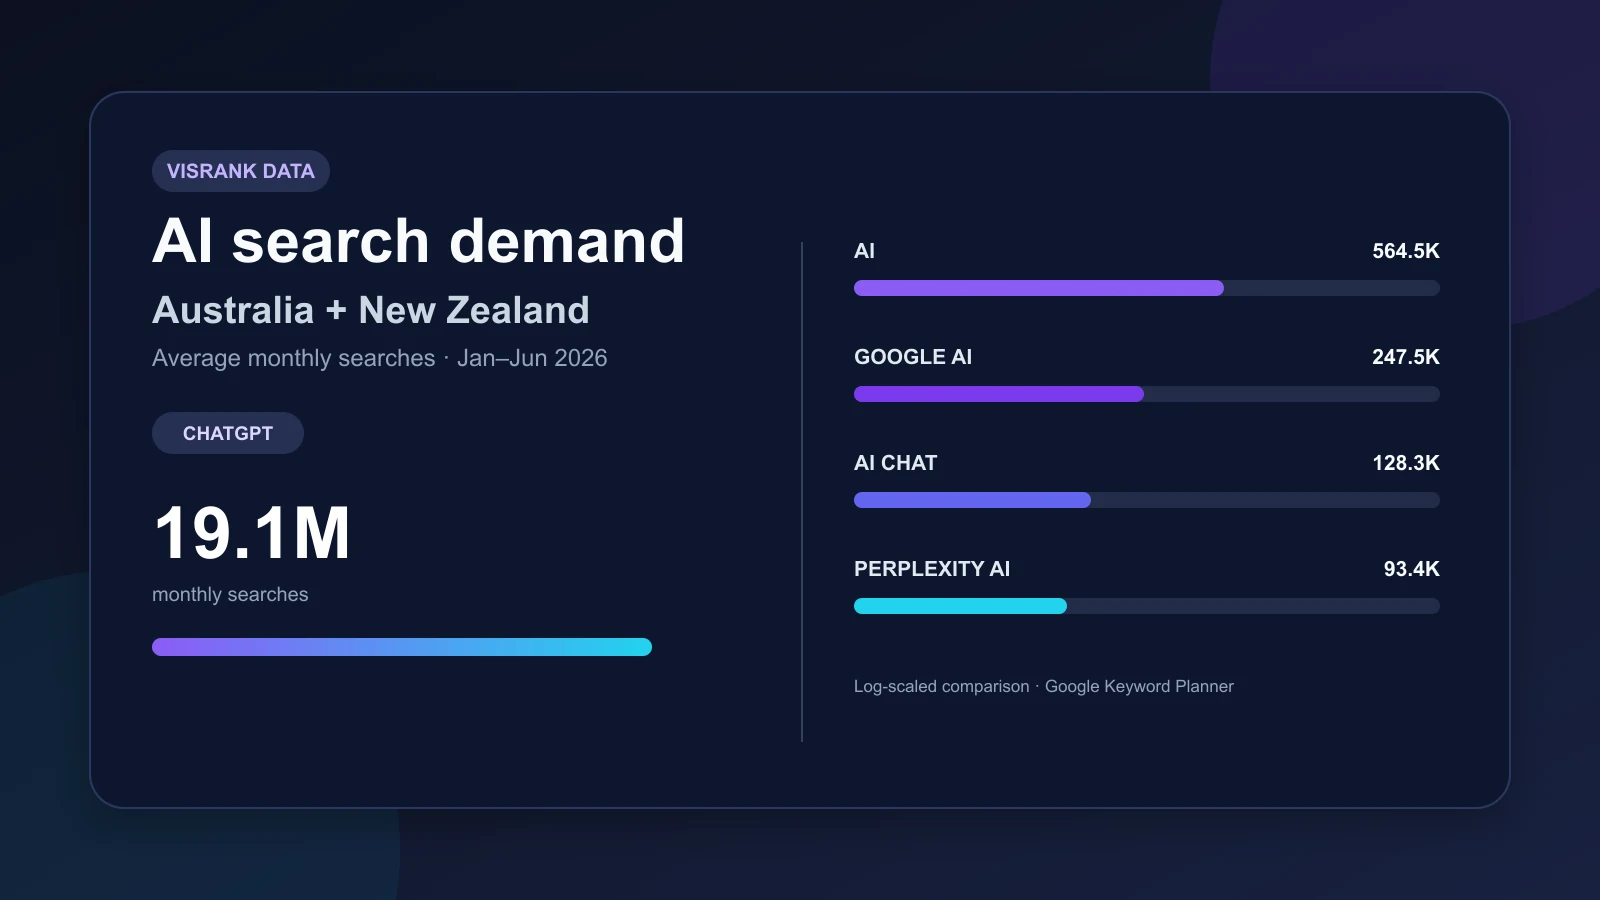
ChatGPT was the dominant AI-related query in a combined Australia and New Zealand Google Keyword Planner export. From January through June 2026, chatgpt averaged 19,133,333 searches per month. The comparable averages were 564,500 for ai, 247,500 for google ai, and 93,417 for perplexity ai.
That does not mean ChatGPT had 19.1 million local users, nor does it establish product market share. It means the rounded historical search estimate for this keyword and its close variants was far larger than the other AI terms in the same export. The distinction matters if you want to quote the finding accurately.
Research record
VisRank exported these figures from Google Ads Keyword Planner on July 28, 2026. Targeting combined Australia and New Zealand, the discovery language was English, the network was Google, and the official Planner window was July 1, 2025 through June 30, 2026. The 2026 YTD figure is the arithmetic mean of the six monthly values from January through June. No July–December 2026 data was estimated.
The cover chart uses a logarithmic comparison so lower-volume terms remain visible. The printed values are the January–June 2026 monthly averages.
What does the Australia and New Zealand data show?
Branded AI demand was concentrated around ChatGPT. Its January–June average was about 34 times the volume of ai, 77 times google ai, and 205 times perplexity ai. These ratios compare search estimates for queries; they are not usage-share calculations.
19.1M
chatgpt average monthly searches, Jan–Jun 2026
564.5K
ai and artificial general intelligence
93.4K
perplexity ai, above the threshold on the 2026 YTD average
Generic conversational terms also cleared the threshold. ai chat, ai chatbot, and artificial intelligence chat each averaged 128,250. They also shared the same monthly curve. That is a warning against adding the three values together: closely related Keyword Planner ideas can overlap.
The 22 keywords above the 90,000 threshold
A phrase entered the table when either its January–June 2026 monthly average or Google's official 12-month average reached 90,000. The relevance label separates direct AI/AEO/SEO demand from broad content, visual-search, and marketing terms. High volume alone does not make a topic useful for VisRank or its readers.
| Keyword | Cluster | 2026 YTD avg | Planner 12-month avg | Threshold basis |
|---|---|---|---|---|
| chatgpt | AI platform | 19,133,333 | 16,600,000 | Both |
| youtube | Content-search adjacent | 18,500,000 | 20,400,000 | Both |
| canva | Content-production adjacent | 3,893,333 | 4,090,000 | Both |
| ai | AI topic | 564,500 | 450,000 | Both |
| artificial general intelligence | AI topic | 564,500 | 450,000 | Both |
| best seo optimization tools | Direct SEO | 481,923 | 201,000 | Both; volatile |
| best seo tools | Direct SEO | 481,923 | 201,000 | Both; volatile |
| ai check | AI-content adjacent | 386,000 | 368,000 | Both |
| google ai | AI platform | 247,500 | 165,000 | Both |
| google images | Visual-search adjacent | 165,000 | 165,000 | Both |
| chat gpt free | AI platform | 164,500 | 165,000 | Both |
| google image search | Visual-search adjacent | 130,833 | 135,000 | Both |
| ai chat | AI chat | 128,250 | 110,000 | Both |
| ai chatbot | AI chat | 128,250 | 110,000 | Both |
| artificial intelligence chat | AI chat | 128,250 | 110,000 | Both |
| reverse image search | Visual-search adjacent | 126,667 | 135,000 | Both |
| youtube shorts | Content-search adjacent | 126,667 | 110,000 | Both |
| semrush seo tools | Direct SEO | 126,238 | 60,500 | 2026 YTD; volatile |
| open artificial intelligence | AI platform | 121,000 | 135,000 | Both |
| google lens | Visual-search adjacent | 103,500 | 110,000 | Both |
| perplexity ai | AI platform | 93,417 | 74,000 | 2026 YTD |
| google ads | Marketing adjacent | 87,750 | 90,500 | Planner 12-month |
Google defines average monthly searches as an average for a keyword and its close variants based on the selected month range, locations, and Search Network. Google also notes that historical volumes are rounded and fluctuate with seasonality and events. See the official Keyword Planner historical metrics explanation.
Why the SEO-tool numbers need a volatility warning
Three direct SEO phrases cleared the cutoff, but their averages hide an unstable shape. best seo tools and best seo optimization tools moved from 70 searches in January and 210 in February to 2,740,000 in March, then fell to 90,500 in April, 260 in May, and 60,500 in June. semrush seo tools followed a similar pattern, peaking at 673,000 in March.
The export does not explain the cause, so this analysis does not invent one. A publisher could investigate a platform event, a reporting change, close-variant grouping, or temporary interest, but the safe conclusion is narrower: the six-month mean is spike-driven and should not be treated as stable baseline demand.
What can and cannot be concluded from this dataset?
Supported by the export
- ChatGPT had much greater measured query demand than the other AI terms in this selected set.
- Google AI, AI chat, AI chatbot, and Perplexity AI all showed meaningful regional search interest.
- Several direct SEO-tool phrases passed the threshold only because of a sharp March 2026 increase.
- Broad terms such as YouTube and Canva had huge demand but weak product fit for an AEO audit article.
Not supported by the export
- The number of active users for ChatGPT, Google AI, or Perplexity.
- Market share, preference, satisfaction, or conversion performance.
- That related keyword variants represent separate audiences that can be summed.
- That publishing for a high-volume phrase will produce rankings, traffic, Discover reach, or AI citations.
How do you make original research easy to cite?
A quotable finding needs more than a large number. It needs a complete evidence unit: the claim, scope, method, date, calculation, source, and limitation close enough together that another writer can preserve the meaning.
- State the narrow claim. Say what the data measures, not what you hope it implies.
- Attach the scope. Name the countries, network, date range, export date, and keyword.
- Show the calculation. Here, the 2026 YTD metric is the mean of six disclosed monthly values.
- Keep the limitation visible. Keyword Planner volumes are rounded search estimates and close variants can overlap.
- Use one canonical source. Update the same research page when the method is repeated instead of scattering incompatible numbers across near-duplicate posts.
Citation-ready wording
VisRank's analysis of Google Ads Keyword Planner data found that chatgpt averaged 19.1 million monthly searches across Australia and New Zealand from January through June 2026. The export used Google network targeting and was collected July 28, 2026; the figure is a rounded search estimate, not an active-user count.
This structure helps human editors verify a statement and gives retrieval systems a coherent passage to extract. It does not guarantee selection as a source. Google says its generative AI features remain rooted in core Search ranking and quality systems; there is no special AI markup that substitutes for useful, indexed, well-supported content. Read Google's official generative AI optimization guide.
How VisRank fits after the research
Keyword Planner answers a demand question. It does not tell you whether the page is crawlable, whether its evidence is visible, whether the company entity is consistent, or whether an answer can be extracted without losing its scope. That is the separate source-readiness problem.
Use the VisRank AEO checker to inspect crawl, schema, answer, and entity signals. Use the AI Citation Audit for answer blocks, proof, prompt coverage, and citation-readiness gaps. The AEO keyword research workflow explains how to turn demand into an answer map, while the LLM visibility report guide covers repeatable prompt and citation measurement.
None of those checks controls ChatGPT, Google AI, Perplexity AI, or another answer system. The useful outcome is a page with fewer technical ambiguities, clearer evidence, and a measurement record that can be revisited.
Quick FAQ
How much ChatGPT search demand was measured in Australia and New Zealand?
The combined export showed an average of 19,133,333 monthly searches for “chatgpt” from January through June 2026. The official 12-month Planner average was 16,600,000. These are rounded search-volume estimates, not active-user counts.
Was ChatGPT searched more than Google AI and Perplexity AI?
In this combined Australia and New Zealand export, yes. The 2026 YTD monthly averages were 19,133,333 for “chatgpt”, 247,500 for “google ai”, and 93,417 for “perplexity ai”. This measures query demand, not product usage or market share.
Can related AI chat keyword volumes be added together?
Not safely. “ai chat”, “ai chatbot”, and “artificial intelligence chat” shared the same monthly curve in this export. Google Keyword Planner can group close variants, so summing them would likely overstate demand.
Why are some SEO tool keywords marked as volatile?
“best seo tools”, “best seo optimization tools”, and “semrush seo tools” were dominated by a March 2026 spike. Their six-month averages clear the threshold, but the surrounding months are much lower.
Does high search volume guarantee traffic or AI citations?
No. Search volume is a demand signal. It does not guarantee ranking, clicks, conversions, Google Discover distribution, inclusion in Google AI features, or citations from an AI chatbot.
Key takeaways
- ChatGPT led the selected AI queries by a wide margin in the combined Australia and New Zealand export.
- Do not convert search estimates into active-user or market-share claims.
- Do not sum close variants when they share identical historical curves.
- Treat spike-driven SEO-tool averages as investigation leads, not stable demand.
- Make research citable by publishing the claim, scope, method, calculation, source, and limitation together.
- Use search volume to find demand and a source-readiness audit to check whether the resulting page is clear, crawlable, and verifiable.
Related articles
Check your website's SEO & AEO score
Free visibility audit - no signup required.
Scan my website for free